



The United States Securities and Exchange Commission (SEC) halted the recovery in the cryptocurrency markets in its tracks. It started with the crackdown on crypto exchange Kraken. On Feb. 9, The SEC announced that Kraken had reached an agreement to pay a $30 million fine and stop its cryptocurrency staking operation for US investors.
Even as crypto investors were digesting this news, the regulators struck another blow, this time to blockchain company Paxos Trust. The SEC issued a wells notice, a notification from the regulator to the recipient about the planned enforcement action against them, to Paxos, alleging that the dollar-pegged Binance USD is an unregistered security.
That was followed by an order from the New York Department of Financial Services asking Paxos to stop the issuance of BUSD. Paxos said it will comply with the order and halt the minting of new BUSD tokens from February 21. However, the firm said in a statement on February 13 that it “categorically disagrees with the SEC staff because BUSD is not a security under the federal securities laws.”
Both these actions by the regulators in the past week have increased nervousness among crypto investors. FOX Business journalist Eleanor Terrett tweeted on February 13 that her sources have said that more crypto firms may be given out wells notices in the coming 2-3 weeks.
If that happens, institutional investors may step aside until there is clarity about the extent of regulatory action on crypto firms.
On the macroeconomic front, investors will be keenly watching for January’s consumer price index data release on February 14. If the data shows inflation cooling off further, it may trigger a rally in risky assets. But if the data is a shocker, risky assets may sell off.
What are the critical levels that may arrest the decline in Bitcoin and the major altcoins? Let’s study the charts to find out.
BTC/USD Market Analysis
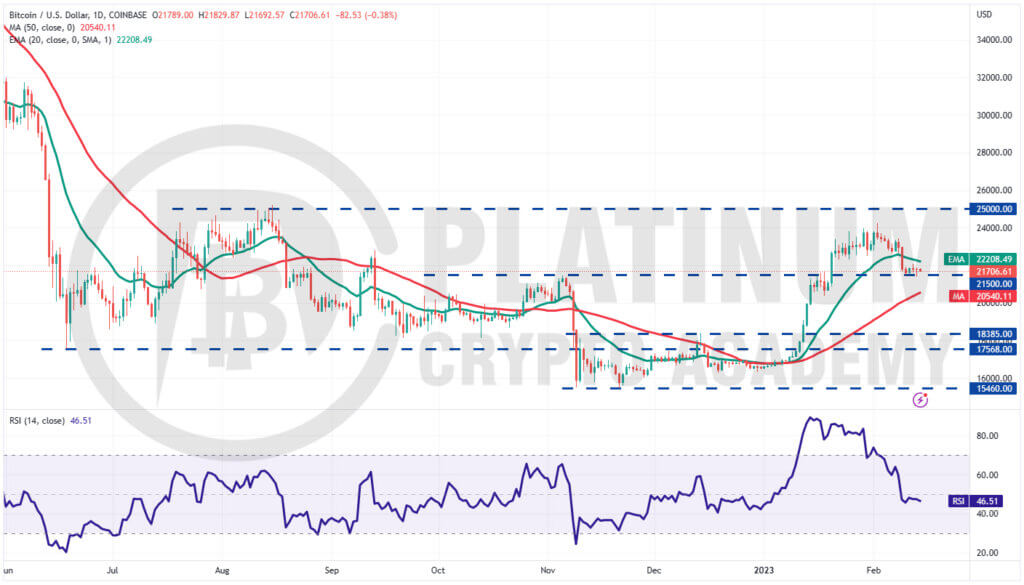
We had cautioned in our previous analysis that if the 20-day exponential moving average (EMA) cracks, Bitcoin could plunge to $21,500 and that is what happened.
Buyers have successfully defended the $21,500 level since February 10 but the weak bounce shows that bears are maintaining their selling pressure.
The 20-day EMA has started to turn down and the relative strength index (RSI) has slipped into the negative territory, indicating that bears have a slight edge.
If the price breaks and closes below $21,500, the BTC/USD pair could plummet to the 50-day simple moving average (SMA).
The zone between $21,500 and the 50-day SMA is likely to attract aggressive buying by the bulls. However, the bears are unlikely to give up easily and will try to stall the relief rallies near the 20-day EMA.
The selling may intensify if the 50-day SMA breaks down and the pair could nosedive to the next support at $18,385.
Contrary to this assumption, if the price turns up from the current level and rises above the 20-day EMA, it will suggest that bulls have flipped the $21,500 level into support. That will increase the possibility of a rally to $23,500 and then to $24,000.
ETH/USD Market Analysis
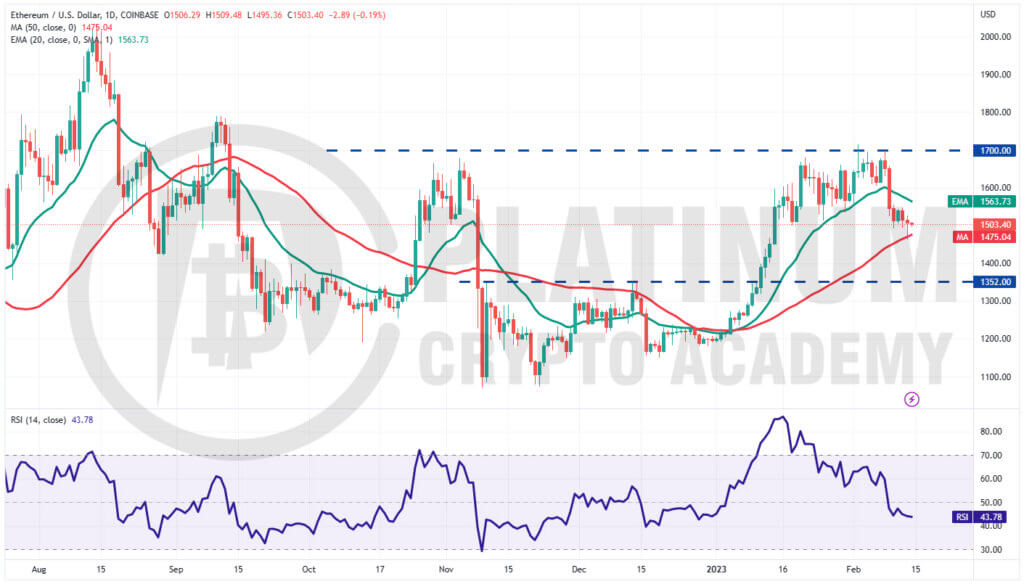
Ether’s tight range trading resolved to the downside on February 9 when the bears pulled the price below the 20-day EMA. The bulls tried to arrest the correction near $1,500 but the bears kept up their selling pressure.
The ETH/USD pair dropped to the 50-day SMA on February 13 but the long tail on the candlestick shows that buyers are attempting to defend the level.
However, the 20-day EMA has started to turn down and the RSI is in the negative territory, indicating that the bears are back in command.
A break and close below the 50-day SMA could open the gates for a potential fall to $1,352. This level is likely to witness solid buying by the bulls.
On the upside, the first sign of strength will be a break and close above the 20-day EMA. That could propel the price to $1,700, which is the key resistance to keep an eye on. If this level is pierced, the pair may start its northward journey to $2,000.
BNB/USD Market Analysis
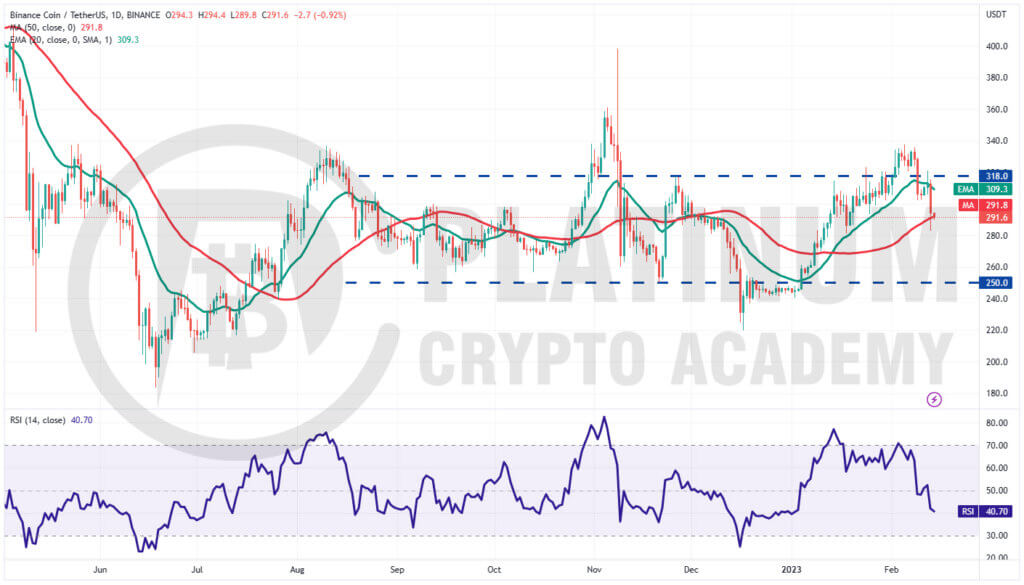
We had suggested in the previous analysis that if Binance Coin slipped below the 20-day EMA, it would indicate that the break above $318 may have been a bull trap.
That could sink the price to the 50-day SMA and that is what happened on February 13. The long tail on the candlestick shows that bulls are attempting to guard the level.
However, the bears are unlikely to give up their hold easily. They will try to sink and sustain the price below $280. If they succeed, the BNB/USD pair could tumble to $250. The bulls are expected to defend this level with vigor.
The first sign of strength will be a rise above the 20-day EMA. Such a move will indicate that bulls are on a comeback. That could enhance the prospects of a rally to $318 and thereafter to $340.
For now, it looks like the pair will extend its stay inside the $250 to $318 range for some more time.
XRP/USD Market Analysis
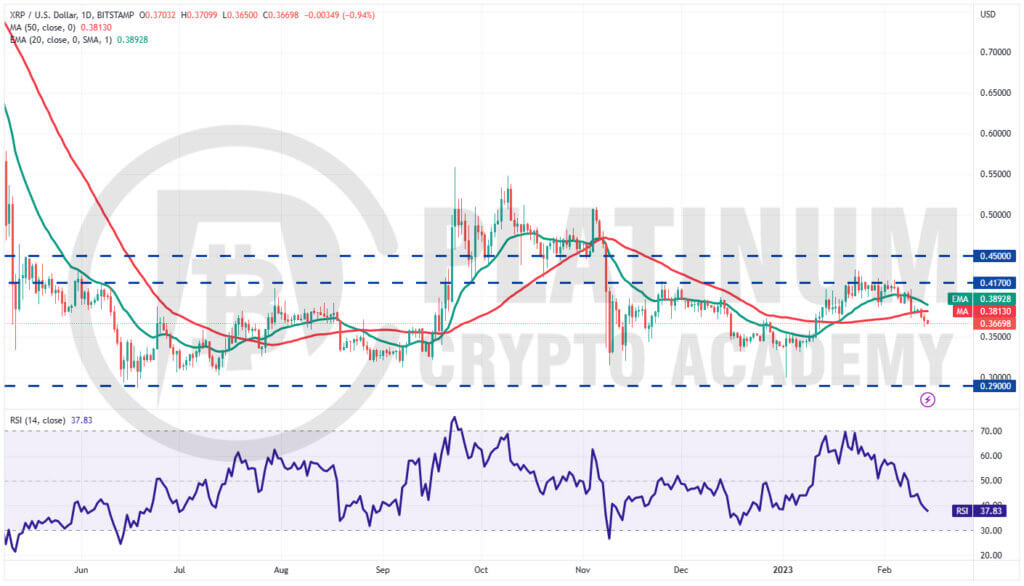
XRP plunged to the 50-day SMA on February 9. The bulls defended the level on February 10 and 11 but the weak bounce shows a lack of aggressive buying.
That encouraged the bears who resumed their selling on February 12. The 20-day EMA is sloping down and the RSI is in the negative zone, indicating that bears have the upper hand.
There is a minor support at $0.35 but if that gives way, the XRP/USD pair may touch the crucial support zone between $0.33 and $0.32. If the price rebounds off this zone with strength, it will point to continued range-bound action.
On the upside, a break above the 20-day EMA could tilt the advantage in favor of the buyers. The pair will then attempt to rise to $0.42. The next trending move is likely to begin after bulls overcome the barrier at $0.42 or bears yank the pair below $0.30. Until then, random and volatile range-bound action is likely to continue.
ADA/USD Market Analysis
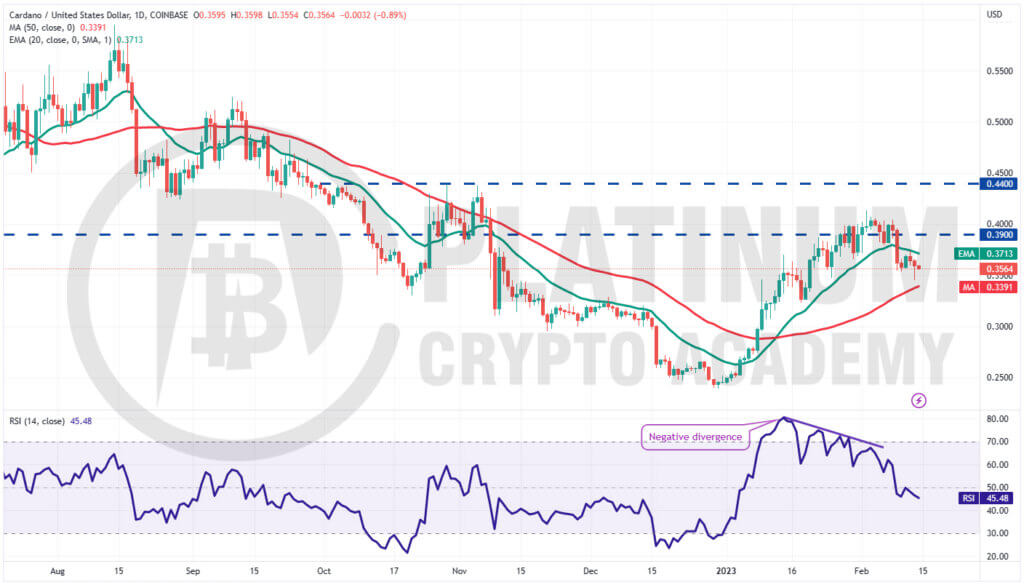
We highlighted in the previous analysis that the buying pressure was reducing and that seems to be the case. The price turned down and broke below the 20-day EMA on February 9.
Buyers tried to push the price back above the 20-day EMA on February 12 but the bears held their ground. The price is stuck between the moving averages, which shows a tough battle between the bulls and the bears.
The 20-day EMA has started to turn down and the RSI has slipped below 46, indicating that bears have a slight edge.
If the price plunges below the 50-day SMA, the pair may find support at $0.30.
Conversely, if the price rises above the 20-day EMA, the pair could jump to $0.41 and thereafter to $0.44.
Hopefully, you have enjoyed today’s article for further coverage please check out our crypto Blog Page. Thanks for reading! Have a fantastic day! Live from the Platinum Crypto Trading Floor.
Earnings Disclaimer: The information you’ll find in this article is for educational purpose only. We make no promise or guarantee of income or earnings. You have to do some work, use your best judgement and perform due diligence before using the information in this article. Your success is still up to you. Nothing in this article is intended to be professional, legal, financial and/or accounting advice. Always seek competent advice from professionals in these matters. If you break the city or other local laws, we will not be held liable for any damages you incur.